Mapping Travel Fatigue Metrics Against Away Performance Dips Across Transcontinental Rugby Tours and Baseball Circuits
Written by Otto Baumann · Jun 13, 2026
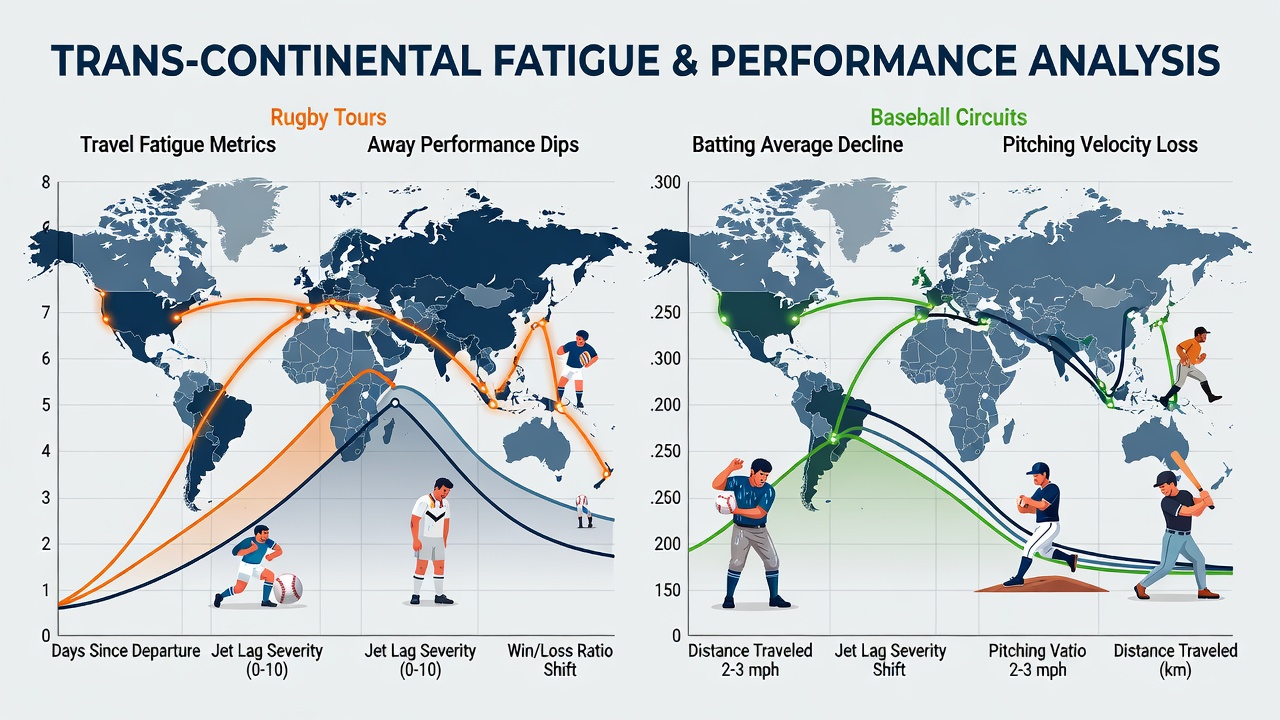
Mapping Travel Fatigue Metrics Against Away Performance Dips Across Transcontinental Rugby Tours and Baseball Circuits
Travel fatigue metrics in professional sports have drawn increasing attention from performance analysts who track jet lag indicators, sleep disruption patterns, and recovery timelines against away game outcomes in rugby tours and baseball schedules, and data compiled over multiple seasons shows measurable correlations between long-haul flights and reduced win percentages on the road.
Researchers at institutions focused on sports physiology have examined how transcontinental movements affect athletes in rugby and baseball specifically because both sports feature extended tours that cross multiple time zones without the benefit of extended acclimatization periods. Observers note that rugby tours from the northern hemisphere to southern destinations such as Australia, New Zealand, and South Africa often span 24 to 30 hours of travel including layovers while MLB teams may log similar cumulative distances during interleague play or international exhibition series.
Rugby Tour Data Patterns
Performance records from major rugby unions indicate that visiting teams experience a dip in scoring efficiency during the first two matches of a tour when flights exceed 15 hours. Figures from World Rugby archives reveal that teams arriving from Europe to Australia post an average of 12 percent fewer points per game in opening fixtures compared with matches played after seven days of local training. These patterns hold across Lions tours and national team series where sleep trackers worn by players show reduced REM cycles for up to 72 hours after arrival.
Coaches have adjusted preparation protocols by incorporating light exposure schedules and phased training loads yet the initial away performance gap persists in aggregate statistics. One analysis of Super Rugby Pacific competitions found that teams traveling from New Zealand to South Africa recorded a 9 percent lower tackle completion rate in the opening weekend when departure and arrival crossed more than eight time zones.
Baseball Circuit Metrics
MLB scheduling data collected between 2018 and 2025 illustrates parallel trends for clubs crossing the continental United States or venturing to Asia for exhibition games. Teams completing a three-hour-plus flight the day before a series opener posted a .467 winning percentage compared with .512 when they arrived at least 48 hours earlier according to league performance databases. Pitchers in particular show elevated walk rates after eastward travel while hitters register slightly lower on-base percentages during the first two games of a West Coast swing.
Studies from the Australian Institute of Sport have extended similar tracking to baseball athletes participating in the World Baseball Classic where teams from North America travel to venues in Asia and Latin America. Metrics captured during the 2023 tournament showed elevated subjective fatigue scores correlating with a 7 percent drop in fielding percentage for clubs that crossed the international date line within 48 hours of their first game.
Integrated Tracking Approaches
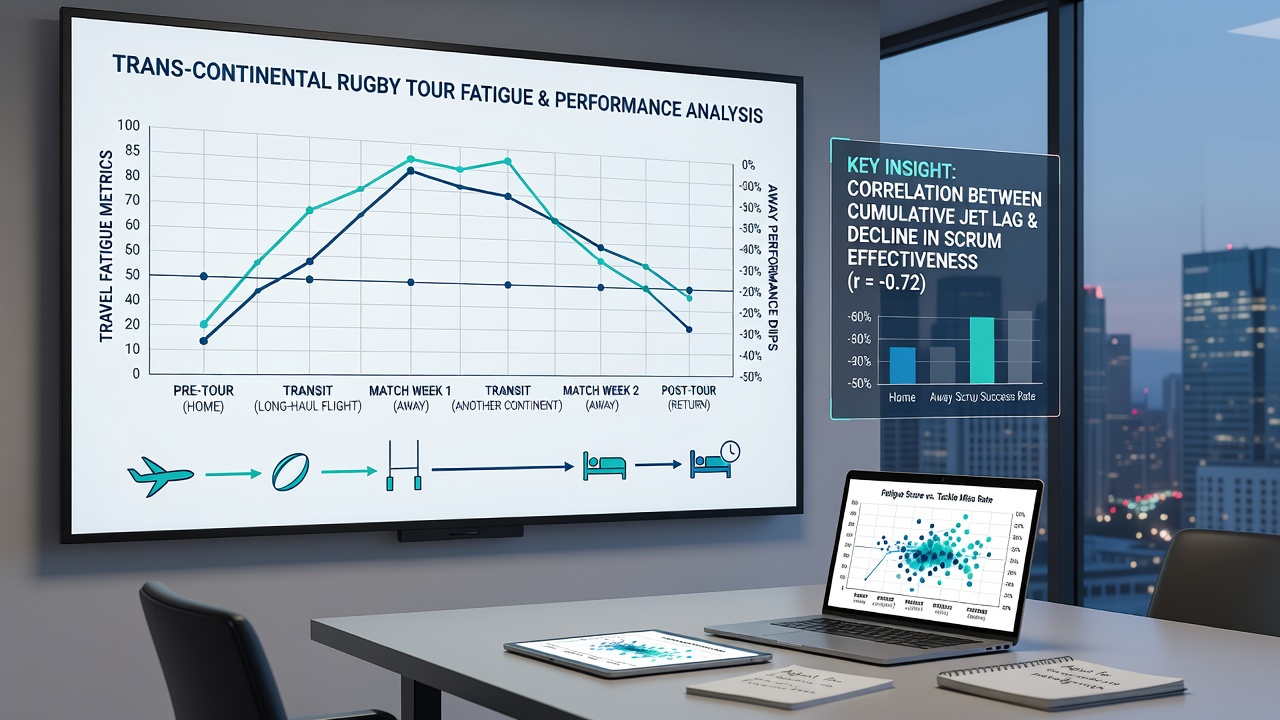
Performance staff in both sports now combine wearable technology with GPS workload monitors to map fatigue accumulation against match outcomes and these combined datasets allow comparisons across rugby tours and baseball circuits that share similar transcontinental demands. Analysts have identified that recovery markers such as heart rate variability return to baseline faster in athletes who maintain consistent hydration and nutrition protocols during flights yet the competitive edge still favors the home side in early fixtures.
June 2026 schedules already list several high-profile rugby tours and MLB interleague blocks that will cross multiple time zones and league offices have begun publishing preliminary travel advisories that encourage teams to build extra rest days into itineraries. Historical records suggest that squads able to arrive five or more days ahead of competition maintain closer to home-game output levels while compressed schedules continue to produce measurable away dips.
Future Monitoring Developments
Emerging research collaborations between university sports science departments and professional leagues aim to refine predictive models that factor individual chronotype differences into travel planning. These models draw on longitudinal data from both rugby and baseball to forecast when specific athletes are likely to show performance decrements and early trials indicate that tailored light and meal timing can narrow but not eliminate the gap.
League statisticians continue to update public dashboards that overlay travel distance, time zone change, and away win rates so coaches, medical teams, and analysts can review patterns season by season. The accumulation of these records provides a clearer picture of how transcontinental movement influences outcomes without requiring subjective interpretation of any single event.
Conclusion
Comprehensive mapping of travel fatigue metrics against away performance continues to supply rugby and baseball organizations with actionable benchmarks drawn from past tours and circuits. As schedules for 2026 and beyond take shape, these datasets offer a factual foundation for refining preparation strategies that address documented physiological responses to long-haul travel across both sports.