Linking Stadium Attendance Fluctuations to On-Field Performance Indicators Across Professional Basketball and Football Circuits
Written by Viktor Keller · Jun 17, 2026
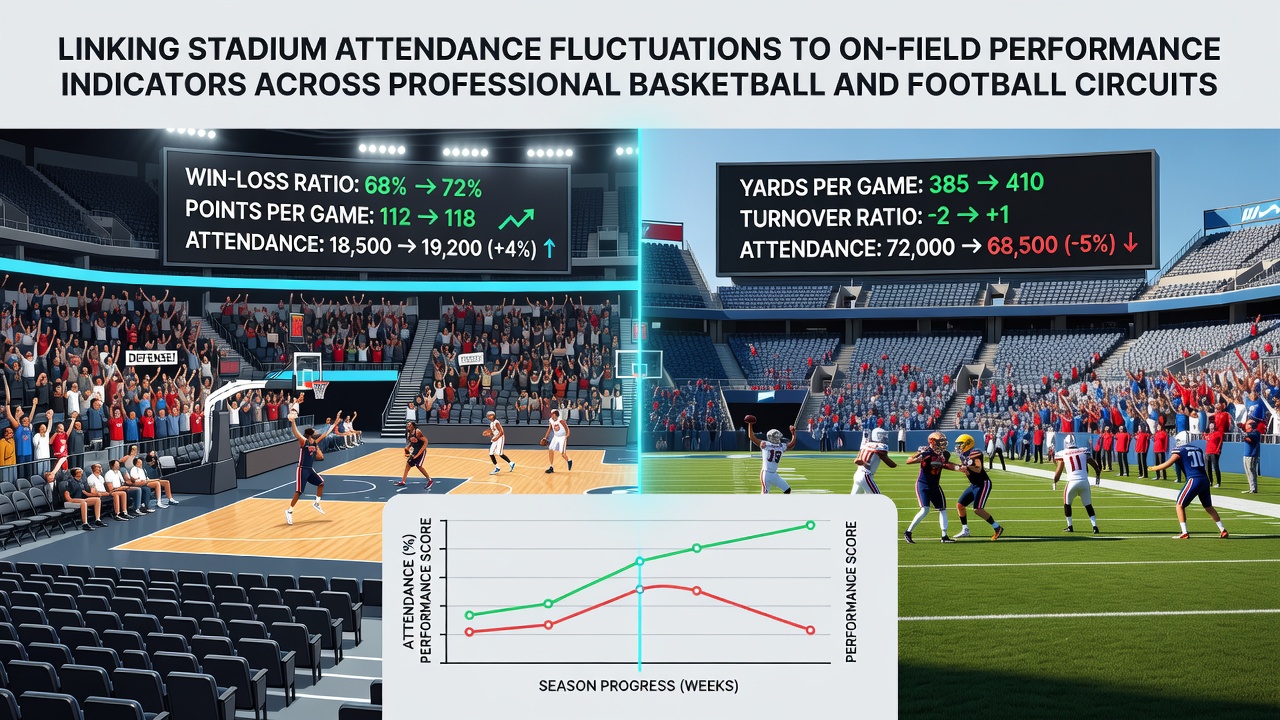
Linking Stadium Attendance Fluctuations to On-Field Performance Indicators Across Professional Basketball and Football Circuits
Attendance figures in professional basketball and football often shift in tandem with on-field results, and analysts track these patterns through metrics such as win percentages, points per game, and defensive efficiency ratings that appear in league databases maintained by organizations like the NBA and major European football federations. Researchers compile season-long datasets that pair ticket sales and gate receipts with box-score outcomes, revealing consistent associations between higher crowds and improved team shooting percentages or goal differentials across multiple campaigns.
Core Performance Indicators Under Scrutiny
Teams monitor several key statistics when examining attendance swings, including offensive rating in basketball measured as points produced per possession and expected goals models in football that quantify scoring opportunities created during matches. Data aggregated by sports analytics groups shows that clubs posting above-average marks in these areas tend to sustain elevated attendance levels week after week, whereas dips in efficiency coincide with measurable drops in season-ticket renewals and walk-up sales. Observers note that these relationships hold across both indoor arenas hosting basketball contests and outdoor stadiums used for football fixtures, although the magnitude varies by market size and historical fan engagement.
Patterns Observed in Basketball Leagues
League-wide reviews of NBA regular-season records demonstrate that franchises achieving winning streaks of five games or longer experience average attendance increases ranging from eight to twelve percent compared with periods of sub-.500 play. Points allowed per game serves as a particularly strong correlate in these analyses, with squads holding opponents under 105 points drawing noticeably larger midweek crowds than those surrendering higher totals. Front-office personnel cross-reference these figures against television ratings and merchandise movement to isolate attendance effects from broader popularity trends that operate independently of single-season results.
Football Circuit Comparisons
Across top-tier football leagues, goal differential over a ten-match window correlates strongly with subsequent attendance changes, and clubs that improve this margin by two or more goals per game commonly report steadier turnstile counts even during adverse weather stretches. European governing bodies publish annual reports that tabulate these variables alongside revenue streams, allowing economists to separate performance-driven attendance from external factors such as competing entertainment options or macroeconomic conditions. In domestic circuits the same linkages surface when analysts examine clean-sheet percentages and their influence on supporter turnout for both home and away fixtures.
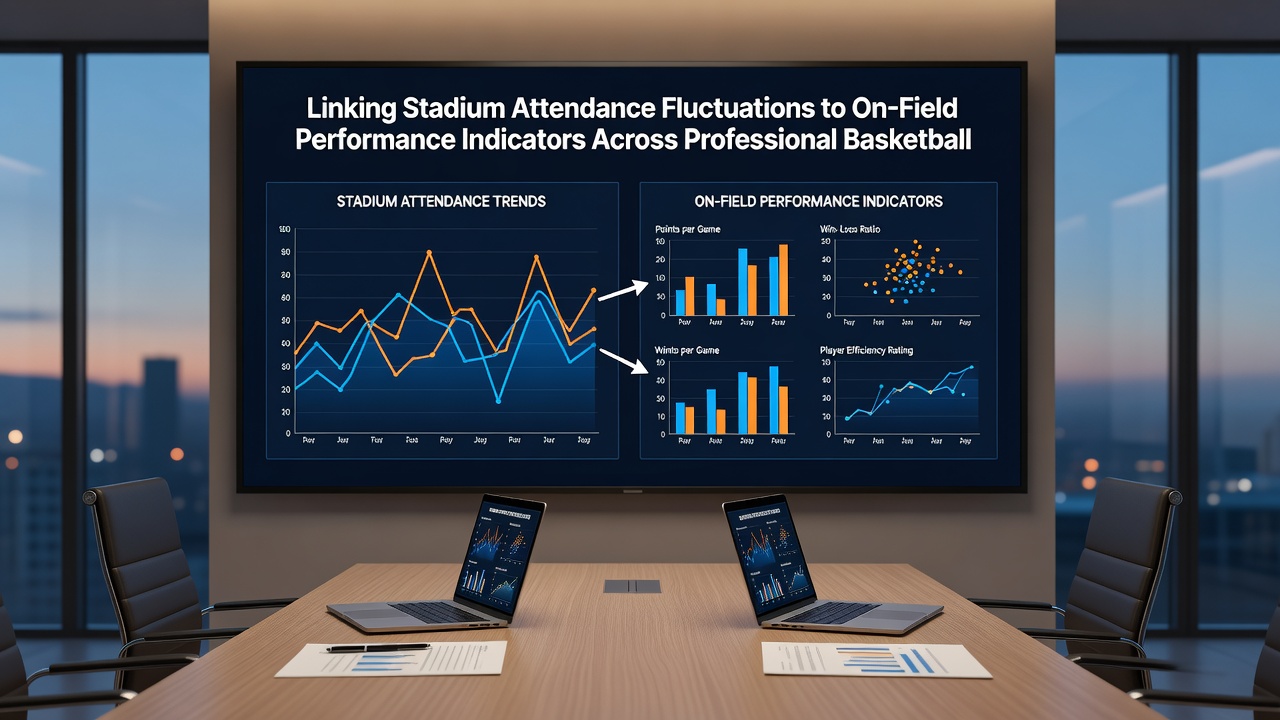
Quantitative Linkages Across Seasons
Statistical models developed by university research centers apply regression techniques to multi-year datasets and consistently isolate performance indicators as significant predictors of attendance variance, explaining between twenty-five and forty percent of observed fluctuations once ticket pricing and schedule strength receive statistical controls. These models incorporate lagged variables so that prior-month win rates help forecast current attendance, and the resulting coefficients remain stable when tested on both North American basketball schedules and European football calendars. Additional controls for star-player availability and broadcast conflicts further refine the estimates without eliminating the core performance-attendance connection.
Regional and Market Variations
Smaller-market franchises display steeper attendance responses to on-field improvements than their larger-market counterparts, according to comparative studies that segment clubs by metropolitan population and historical revenue tiers. In basketball this pattern appears when expansion teams post rapid gains in defensive rating and subsequently fill previously sparse lower bowls. Football examples surface in second-division sides that climb league tables through improved set-piece conversion rates and then sustain higher gate receipts across promotion pushes. Such differences underscore why front offices tailor marketing campaigns around specific performance thresholds rather than uniform league averages.
Methodological Considerations in Current Analyses
Contemporary research employs advanced tracking data that capture player movement and tactical adjustments alongside traditional box scores, allowing finer-grained attribution of attendance shifts to particular facets of play such as transition efficiency in basketball or high-press success rates in football. Reports issued through academic consortia and industry partnerships supply standardized protocols for matching these granular metrics with daily ticket-scanning records, reducing measurement error that once clouded earlier correlational work. Analysts continue to update these frameworks with each completed season to account for rule tweaks and evolving fan behaviors documented through surveys conducted by independent research institutes.
Conclusion
Comprehensive examination of attendance and performance records across professional basketball and football circuits demonstrates measurable, replicable associations that league administrators and club executives monitor through established statistical pipelines. Continued refinement of data-collection methods promises even clearer delineation of how on-field indicators translate into sustained supporter engagement at venues worldwide.