How Weather Patterns Have Shaped Statistical Milestones Across Outdoor Professional Circuits
Written by Sam Walter · May 27, 2026

How Weather Patterns Have Shaped Statistical Milestones Across Outdoor Professional Circuits
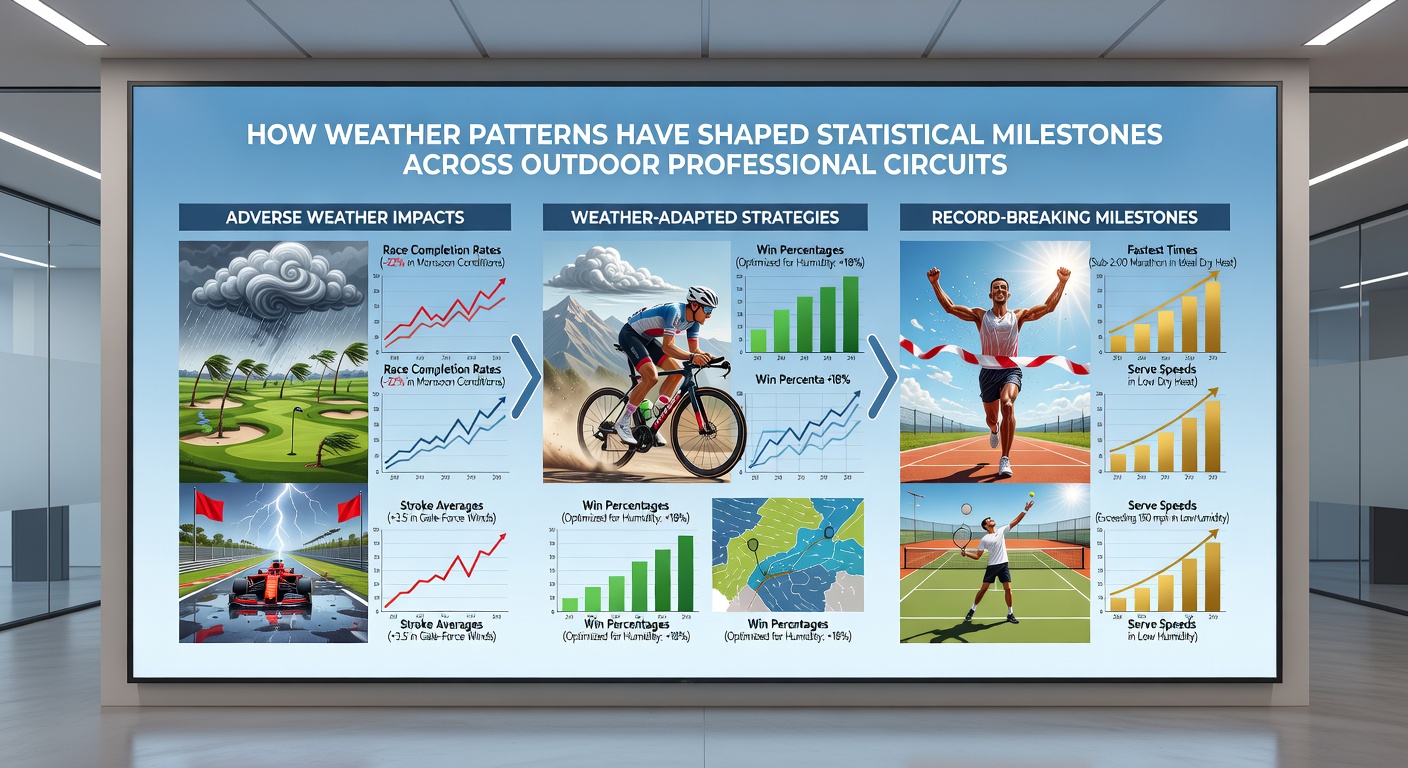
Weather conditions have long influenced performance metrics in outdoor professional sports, where temperature shifts, precipitation levels, and wind speeds alter everything from scoring averages to endurance records. Data collected across multiple decades shows consistent patterns in how these variables reshape league tables and individual achievements in circuits like Major League Baseball, the PGA Tour, ATP and WTA tennis tours, Formula 1, and professional cycling events.
Baseball and Temperature-Driven Power Surges
Researchers at institutions tracking MLB statistics have documented that games played above 80 degrees Fahrenheit produce elevated home run rates compared to cooler conditions, with studies linking each additional degree to measurable increases in fly ball carry distance. Pitchers in those environments record lower strikeout percentages while batters post higher slugging figures, patterns that repeat across stadiums from Arizona to Florida during peak summer months. In May 2026, early-season data from warm-weather venues continues to highlight these trends as teams adjust lineups and bullpen strategies accordingly.
Golf Wind Effects on Scoring Benchmarks
PGA Tour records reveal that sustained winds exceeding 15 miles per hour correlate with scoring averages rising by several strokes per round at coastal and links-style venues, while calm days produce sub-par aggregates that challenge historical benchmarks. Driving distance metrics drop noticeably under gusty conditions, forcing players to alter club selection and affecting fairway accuracy percentages tracked by official tour statisticians. Observers note that major championships scheduled in shoulder seasons often feature these variables, which in turn influence money list positions and qualification pathways for year-end events.
Tennis Surface and Precipitation Interactions
ATP and WTA match logs demonstrate that rain delays on outdoor hard and clay courts extend rally lengths and reduce serve percentages, with wet conditions slowing ball speeds and elevating baseline rally counts. Tournament organizers at venues like the French Open and Indian Wells have compiled data showing how humidity spikes above 70 percent alter player fatigue indicators, reflected in higher rates of medical timeouts and extended match durations. These shifts directly impact win probabilities for aggressive versus defensive styles, reshaping head-to-head records across the spring and summer swings.
Formula 1 and Variable Atmospheric Conditions
Formula 1 telemetry data indicates that wet track sessions produce higher rates of position changes during races, while high temperatures affect tire degradation curves and force strategic adjustments visible in lap time consistency metrics. Historical race results from circuits in Singapore and Monaco show how evening humidity levels influence engine performance outputs, contributing to unexpected points allocations that alter championship standings. Teams monitor forecasts from regional meteorological services to optimize setups, patterns that repeat season after season.
Cycling and Elevation-Weather Combinations
Professional cycling stage races, including the Giro d'Italia and Vuelta a España, compile power output and time-gap statistics that reflect how crosswinds and rain combine with mountainous terrain to create selection points earlier than forecasted. Data from the Union Cycliste Internationale shows that headwinds on flat stages increase average speeds for breakaway groups while reducing bunch sprint opportunities, directly affecting green jersey competitions. Riders who excel under these mixed conditions accumulate points totals that separate them in general classification battles by season's end.
According to reports from NOAA climate archives, long-term weather datasets reveal recurring correlations between El Niño phases and altered precipitation patterns at North American outdoor venues, which statisticians then map against performance records. Similar analyses from the Australian Bureau of Meteorology track how heatwaves in the Southern Hemisphere impact cricket and tennis metrics during their respective summers.
Broader Patterns Across Multi-Sport Calendars
Across these circuits, weather databases integrated with performance tracking systems allow analysts to isolate variables and project how upcoming schedules may influence qualification thresholds for playoffs or finals. Events in May 2026, such as clay court tennis swings and early baseball interleague play, continue to provide fresh data points that refine existing models without altering established methodologies. The cumulative effect appears in revised all-time lists where adjusted expectations account for documented environmental influences rather than raw totals alone.
Conclusion
Statistical milestones in outdoor professional sports therefore emerge from the intersection of athletic output and measurable atmospheric conditions, with records maintained by governing bodies reflecting these interactions across seasons and regions. Continued monitoring through established meteorological and sports data partnerships supports ongoing analysis of how such factors shape competitive outcomes.