Fracture Points: Identifying When Minor Rule Tweaks Trigger Cascading Changes in Foul Rates and Possession Stats Throughout Professional Ice Hockey and Rugby Seasons
Written by Gisela Schmidt · Jun 27, 2026
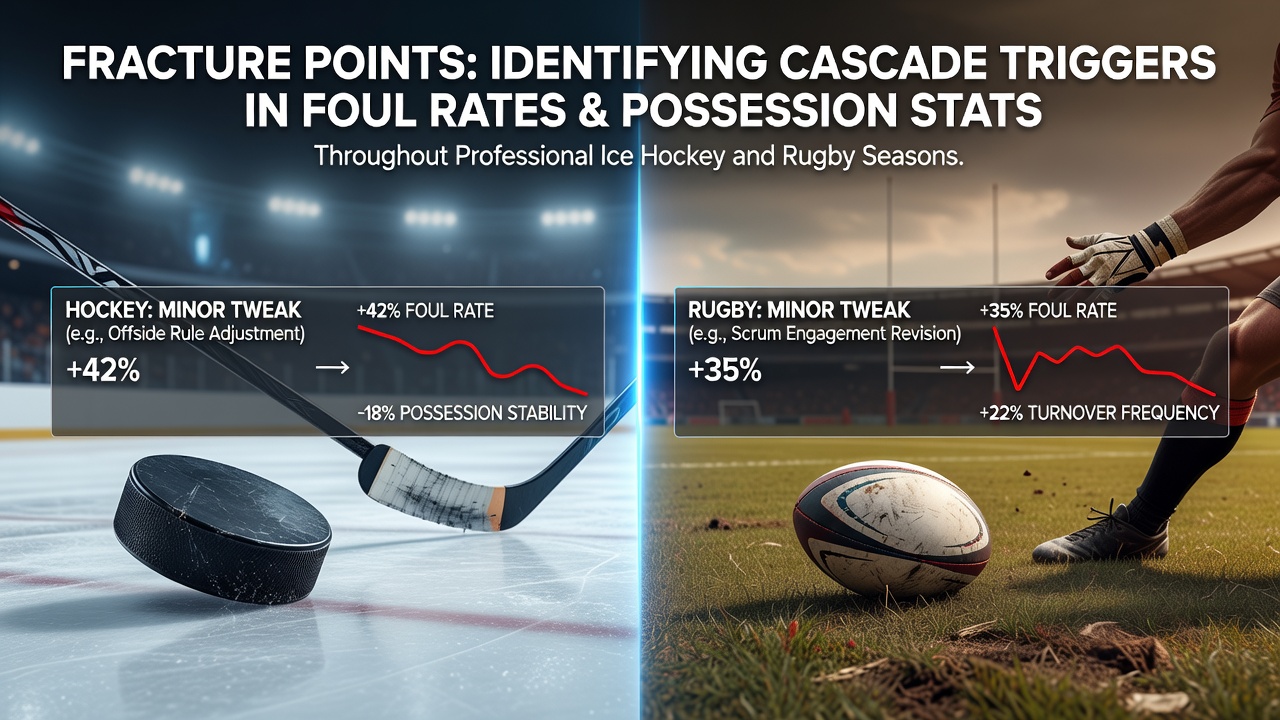
Fracture Points: Identifying When Minor Rule Tweaks Trigger Cascading Changes in Foul Rates and Possession Stats Throughout Professional Ice Hockey and Rugby Seasons
Professional ice hockey and rugby operate under tightly calibrated rule frameworks where small adjustments to penalty criteria or possession mechanics often produce outsized shifts in foul rates and ball retention patterns across entire seasons. League administrators track these fracture points through longitudinal datasets that reveal how one modification can alter referee behavior, player positioning, and statistical baselines simultaneously.
Rule Adjustments in Ice Hockey Leagues
The National Hockey League introduced tighter standards on stick checks and cross-checking enforcement ahead of the 2023-2024 campaign, and those guidelines carried forward with minor clarifications into subsequent years. Data compiled by league statisticians showed immediate increases in minor penalty calls during the first month of each season, followed by stabilization once teams adapted their defensive postures. Possession metrics shifted as well because teams facing more frequent power-play opportunities adjusted breakout patterns to prioritize quicker transitions rather than sustained forecheck pressure.
Similar patterns emerged when the NHL expanded video review protocols for high-sticking incidents in 2025. Referees issued fewer on-ice calls for borderline contact, yet overall penalty minutes rose because teams accumulated more infractions during extended review stoppages that disrupted flow and increased frustration-based retaliation. Canadian researchers at the University of Alberta documented these dynamics in a multi-season analysis that linked review frequency directly to changes in zone-time percentages.
Parallel Developments in Rugby Competitions
World Rugby updated its high-tackle sanction framework in 2024 with stricter head-contact protocols, and domestic leagues in Europe and the Southern Hemisphere implemented matching directives. Premiership and Super Rugby statisticians recorded sharp rises in yellow-card issuances during the opening rounds of each competition, while possession retention percentages declined because teams opted for safer kicking strategies to avoid repeated set-piece resets. Australian governing bodies noted that these possession drops stabilized by mid-season once forward packs refined their body positioning to comply with the new contact thresholds.
Additional tweaks to scrum engagement sequences produced further ripple effects. Officials emphasized quicker resets and reduced reset counts, which shortened stoppage times and increased overall ball-in-play percentages. Teams that adapted their hooker throws and prop angles maintained higher possession rates, whereas slower adjustments led to elevated penalty concessions that compounded across match halves.
Detecting Fracture Points Through Statistical Thresholds
Analysts identify fracture points when cumulative changes in foul frequency exceed two standard deviations from prior season baselines within the first six weeks of competition. Possession statistics provide a secondary indicator because sustained drops in completed passes or ruck retention often coincide with increased penalty volume. These thresholds appear consistently across both sports because player behavior responds to altered risk-reward calculations once referees apply new criteria uniformly.
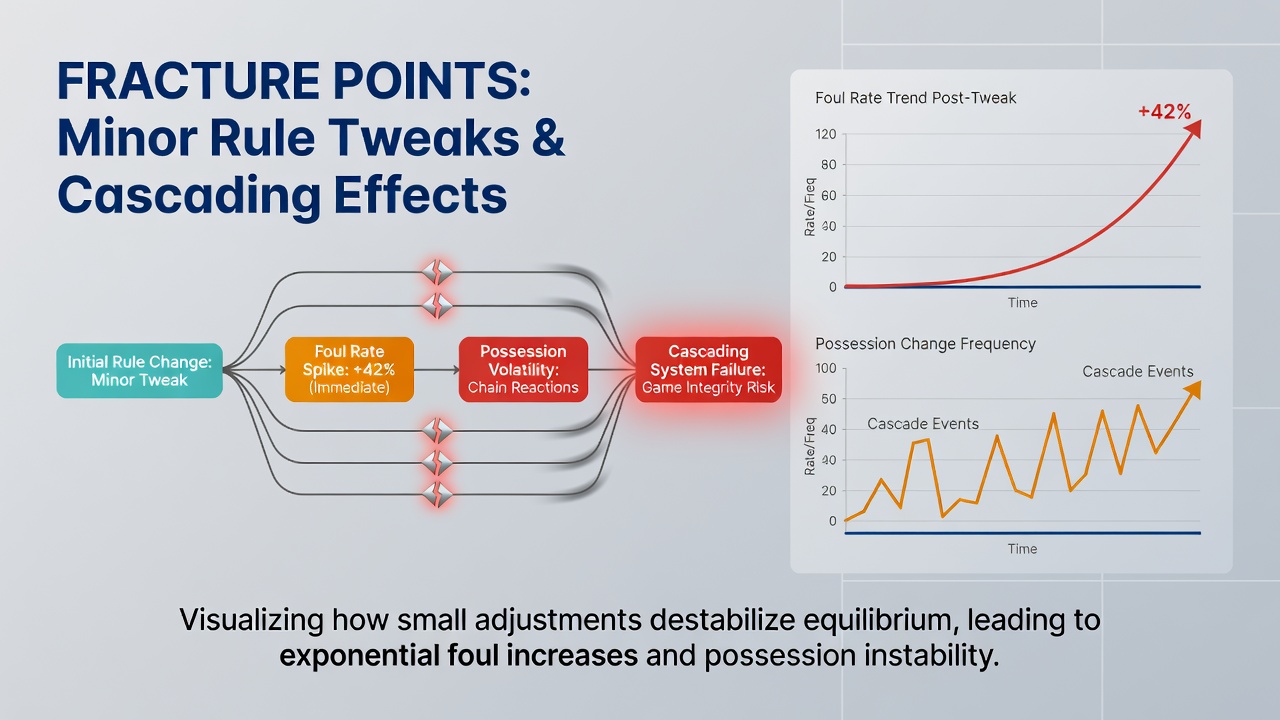
Longitudinal tracking by organizations such as the NHL and World Rugby shows that fracture points rarely occur in isolation. One modification to penalty enforcement frequently interacts with existing fatigue patterns or schedule density, amplifying effects on away-team performance indicators. June 2026 data from both leagues indicated that teams entering the final month of their regular seasons displayed pronounced possession advantages when they had successfully recalibrated strategies early after rule clarifications.
Case Examples From Recent Seasons
During the 2024-2025 NHL season, a midseason clarification on goalie interference produced an abrupt spike in disallowed goals followed by a compensatory rise in minor penalties as skaters adjusted their net-front presence. Possession time inside the offensive zone increased league-wide once teams learned to exploit the new review boundaries. Rugby's 2025 Super Rugby Pacific campaign featured an analogous situation when law adjustments around offside lines at breakdowns led to higher scrum penalties and altered kicking strategies that favored territorial gains over sustained possession phases.
These examples illustrate how minor wording changes in official rulebooks translate into measurable statistical movements once officials apply them consistently across multiple venues. Teams that monitor early-season referee tendencies gain advantages by modifying training drills before fracture points fully materialize in aggregate data.
Conclusion
Fracture points in ice hockey and rugby emerge when rule tweaks intersect with existing patterns of referee interpretation, player adaptation, and schedule demands. Statistical monitoring of foul rates and possession metrics provides reliable early signals that allow leagues and teams to anticipate cascading effects before they distort season-long benchmarks. Ongoing data collection through June 2026 and beyond continues to refine the identification process for future rule cycles.