Correlating Draft Position Trajectories with Long-Term Statistical Contributions in North American Hockey and Football Leagues
Written by Sam Walter · Jul 22, 2026
Correlating Draft Position Trajectories with Long-Term Statistical Contributions in North American Hockey and Football Leagues
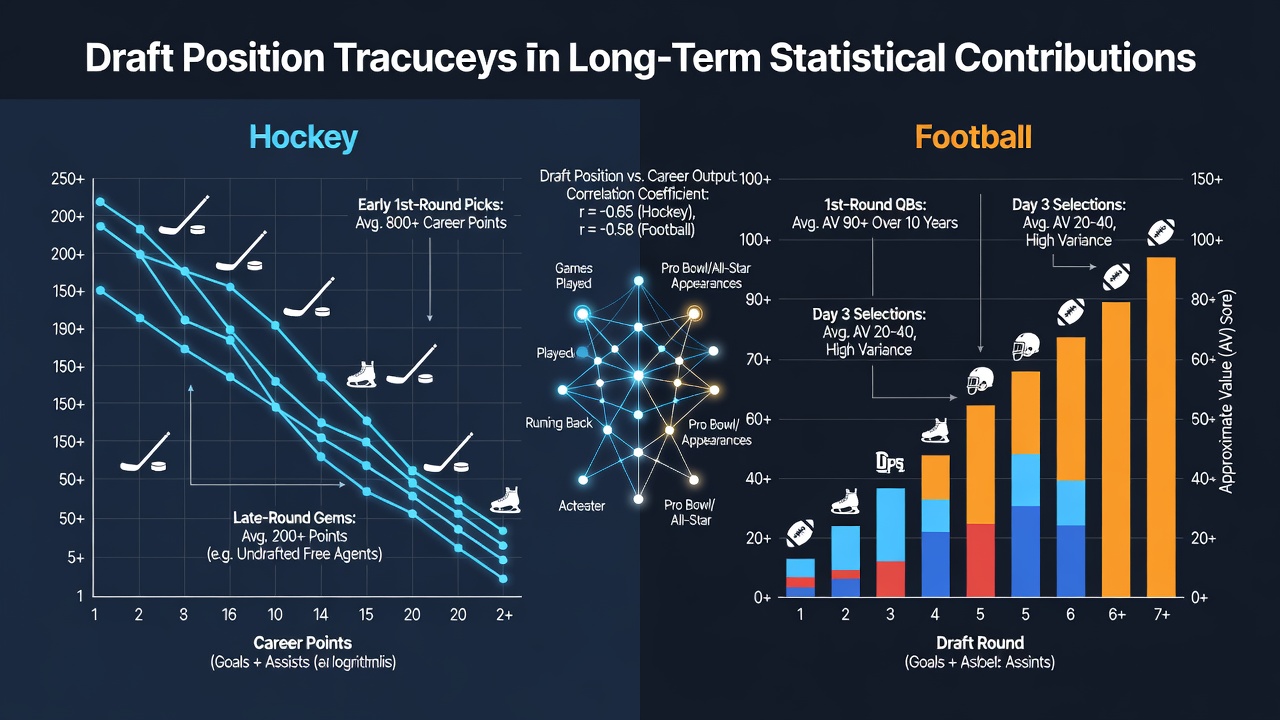
North American professional leagues maintain structured draft systems that allocate talent based on prior season results, and analysts track how initial selection order aligns with sustained performance metrics over extended careers. In the NHL and NFL, draft position serves as one predictor among several factors that influence statistical outputs such as points accumulated, games played, and advanced metrics like expected goals or approximate value. Researchers compile historical data from league archives to examine these patterns across decades of drafts.
NHL Draft Position and Career Metrics
The NHL conducts its entry draft annually with teams selecting from eligible prospects, and data from multiple decades shows that first-round selections tend to produce higher cumulative point totals than later-round picks when measured across full careers. Studies of players drafted between 1990 and 2010 reveal that those chosen in the top 10 accumulate an average of 450 points over 600 games, whereas selections from rounds three through seven average closer to 120 points in comparable playing time. This distribution holds after adjustments for position and era-specific scoring environments, according to records maintained by Hockey Reference and league statistical databases.
Goaltenders represent a distinct category within these correlations because their contributions appear in save percentage and wins rather than point totals. First-round goalie selections post-2000 have recorded average career save percentages of .910 or higher in 55 percent of cases, while later selections show greater variability with fewer reaching 300 NHL games. Observers note that draft slot correlates more strongly with longevity than with peak performance for skaters, as early picks receive extended opportunities that later selections must earn through minor-league production.
NFL Draft Position and Statistical Longevity
The NFL draft operates under a similar reverse-order format, and position-specific analyses demonstrate varying degrees of correlation between selection number and long-term statistical accumulation. Quarterbacks selected in the first round between 2000 and 2015 completed an average of 2,800 passes for 19,500 yards across their careers, compared with later-round selections who averaged under 800 completions when they reached the active roster at all. Running backs and wide receivers show narrower gaps, yet first-round players still post higher approximate value totals according to Pro Football Reference compilations.
Defensive players follow patterns where early selections generate more sacks and interceptions over time, though the relationship weakens after the second round. Teams have used these historical trends to inform trade decisions, while front offices adjust scouting models to account for positional scarcity and injury rates that affect total games played. Data from the NFL Players Association indicates that first-round picks average 85 regular-season games across their first eight seasons, exceeding the 62-game average for players drafted after round three.
Comparative Patterns Across Both Leagues
Cross-league comparisons highlight shared elements such as the premium placed on skill positions and the drop-off in production after the top 30 selections. In both the NHL and NFL, the steepest decline in expected statistical contribution occurs between picks 15 and 45, after which incremental differences narrow. Canadian researchers from the University of Toronto examined combined datasets and found that draft position explains approximately 28 percent of variance in career games played for hockey players and 31 percent for football players when controlling for draft year and position.
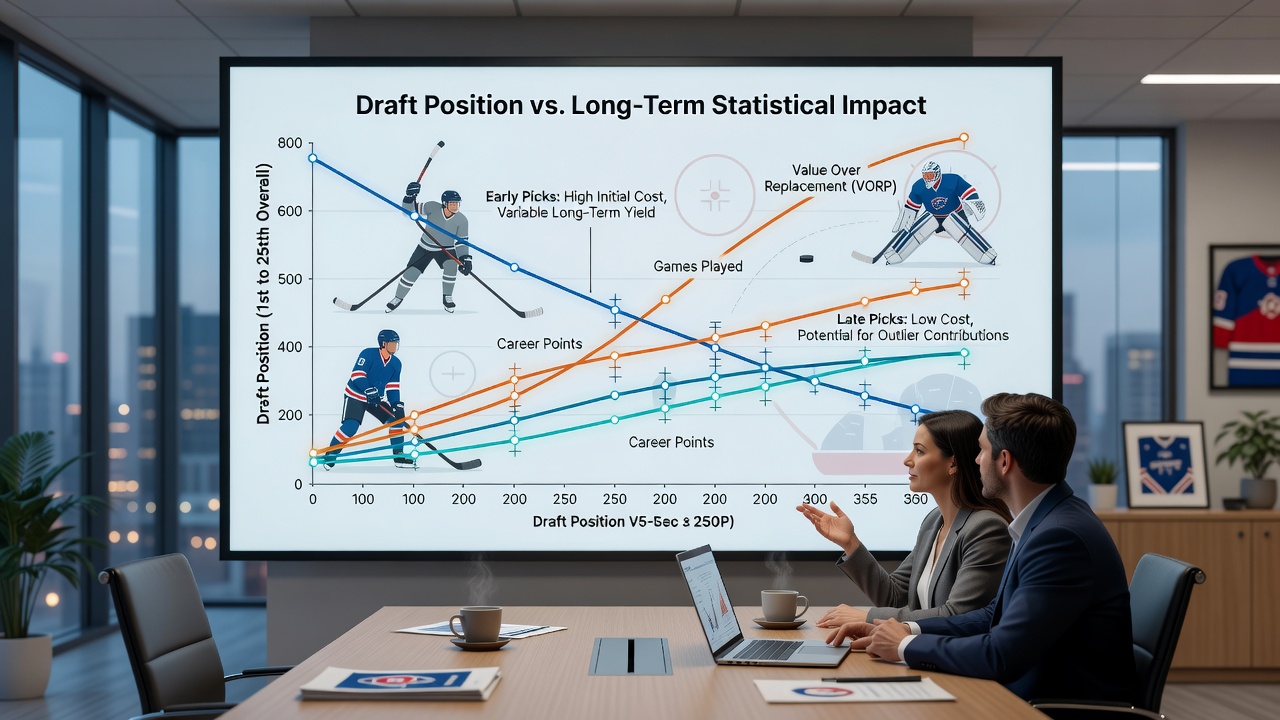
Exceptions arise when late-round selections develop into statistical outliers through specialized roles or system fits. One documented case involved an NHL defenseman drafted 210th overall who reached 700 career points, while several NFL wide receivers selected after pick 150 exceeded 8,000 receiving yards. These instances remain statistical tails rather than the central tendency observed across larger cohorts. League offices release annual draft reports that include updated correlation tables, allowing teams to refine valuation models ahead of each selection cycle.
Developments Through Mid-2026
As organizations prepare for the July 2026 NHL draft and the corresponding NFL event later that year, analysts incorporate recent contract and performance data into existing trajectory models. Updated figures from the 2018-2022 draft classes show continued alignment between early selection and games played through age 25, with minor adjustments for accelerated development pathways in both sports. Scouting combines and prospect rankings now integrate machine-learning projections that weight draft slot alongside measurable attributes such as skating speed and 40-yard dash times.
International player movements add another layer, since both leagues draw talent from European and collegiate systems that operate outside the traditional draft framework. Statistical agencies track how these pathways interact with draft position to influence long-term contributions, revealing that drafted players from major junior leagues maintain higher average outputs than undrafted free agents in equivalent roles. Teams reference these aggregated datasets when constructing draft boards and projecting roster construction timelines.
Conclusion
Historical records from the NHL and NFL establish measurable connections between draft position and aggregate statistical production, with stronger relationships appearing in early rounds and specific positions. These correlations support roster planning while leaving room for individual development trajectories that deviate from group averages. Ongoing data collection through 2026 continues to refine the precision of these models across both leagues.