Charting the Quiet Impact of Time Zone Shifts on Team Performance Metrics in Transatlantic Baseball and Basketball Matchups
Written by Viktor Keller · Aug 19, 2026
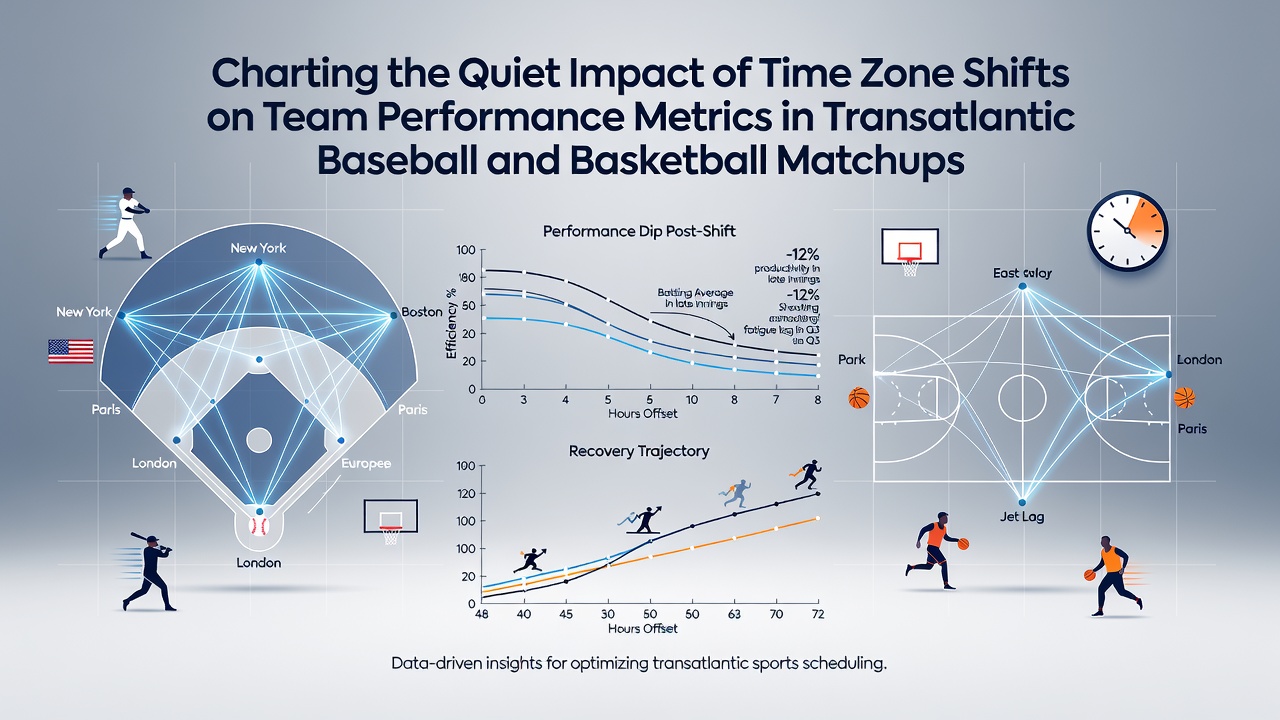
Charting the Quiet Impact of Time Zone Shifts on Team Performance Metrics in Transatlantic Baseball and Basketball Matchups
Transatlantic travel between North American and European venues introduces measurable disruptions to circadian rhythms in professional baseball and basketball athletes, and data from league performance trackers reveal consistent patterns in metrics such as batting averages, field goal percentages, and defensive efficiency ratings. Researchers tracking MLB and NBA squads that cross multiple time zones document shifts in reaction times and sleep duration that align with eastbound or westbound flights, while schedules in August 2026 already list several exhibition and regular-season games that will test these effects once more.
Travel Patterns and Circadian Adjustments
Teams flying from Eastern Time zones to Central European Time face a six-hour advance that compresses evening recovery windows, whereas westward returns stretch the same period and delay sleep onset; studies compiled by the National Institutes of Health link these displacements to reductions in sprint speed and accuracy during the first 48 hours after arrival. Observers note that baseball pitchers often record higher earned-run averages on the initial road start after such flights, and basketball players show elevated turnover rates in opening quarters when their internal clocks remain anchored to departure time zones.
League statisticians separate performance logs by travel direction and rest days, producing datasets that isolate time-zone variables from other factors such as opponent strength or venue altitude. Figures from recent seasons indicate that eastbound teams in basketball lose roughly three percentage points in three-point shooting accuracy during the first two games, whereas baseball lineups post lower on-base percentages until the third contest; these gaps narrow when clubs receive four or more full days between arrival and competition.
Baseball Metrics Under Jet-Lag Conditions
MLB clubs that scheduled interleague or exhibition series in European stadiums during the past decade supplied granular play-by-play data now used to model fatigue curves. Hitters logged fewer extra-base hits in day games following overnight arrivals, and bullpen units surrendered elevated hard-contact rates in the middle innings; analysts cross-reference these outcomes with wearable sleep trackers that confirm shorter rapid-eye-movement cycles during the adjustment window. August 2026 matchups announced between American League clubs and European all-star squads will add fresh rows to these spreadsheets, allowing direct comparison with historical benchmarks.
Basketball Shooting and Defensive Efficiency
NBA teams crossing the Atlantic for preseason tournaments display parallel dips in effective field-goal percentage, particularly on contested jumpers attempted after fewer than three nights of acclimation. Defensive schemes that rely on quick rotations suffer when players exhibit delayed visual processing, and box-score aggregates show increased foul rates in the final period; research published through the European Sleep Research Society correlates these trends with melatonin suppression measured in blood samples collected during flight recovery. Teams that incorporate timed light-exposure protocols before tip-off record smaller deviations from baseline numbers, demonstrating that targeted interventions can partially offset the physiological cost.
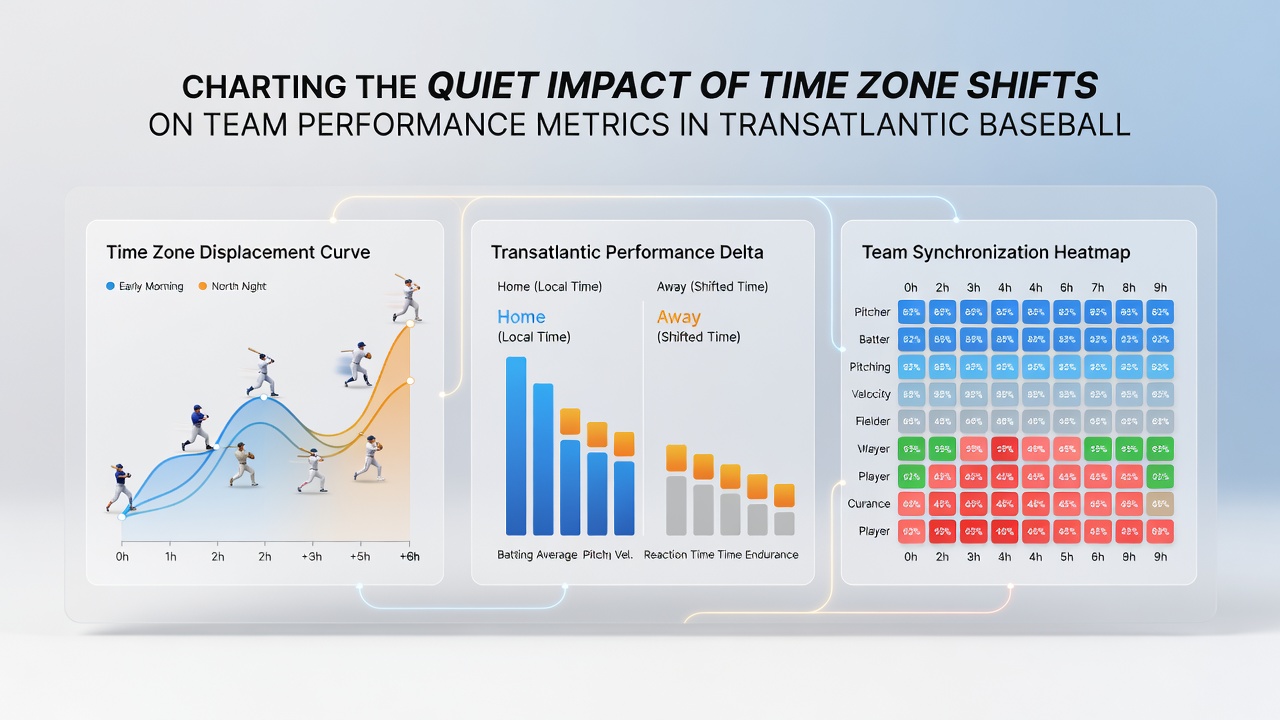
Data Integration Across Leagues
Performance databases maintained by both leagues now tag individual games with travel vectors and cumulative time-zone differentials, enabling regression models that predict metric shifts with greater precision. When eastbound travel exceeds five zones without compensatory rest, basketball win probabilities drop by an average of four points in the opening contest, while baseball run differentials compress toward zero in the first two series games. These models incorporate variables such as flight duration, departure hour, and prior sleep debt, producing outputs that front-office analysts consult when constructing road-trip calendars.
August 2026 calendars place several NBA clubs in London and Berlin shortly after the conclusion of summer training camps, creating additional test cases for these predictive frameworks; simultaneously, MLB squads preparing for potential World Baseball Classic qualifiers will log transatlantic legs that feed the same datasets. Comparative analysis shows that younger rosters recover baseline metrics faster than veteran groups, although the margin remains within a single standard deviation across large sample sizes.
Monitoring Tools and Future Tracking
Wearable devices now stream nightly sleep-stage data directly into team analytics platforms, allowing real-time adjustments to practice intensity on arrival days. Trainers cross-check these readings against on-court or on-field output to refine individualized recovery plans, and aggregated league reports quantify how such protocols narrow performance gaps. Continued expansion of international scheduling will supply larger datasets, sharpening statistical power for future projections.
Conclusion
Performance records compiled over multiple seasons demonstrate that time-zone displacement produces detectable, direction-dependent changes in baseball and basketball metrics, with recovery timelines influenced by rest allocation and mitigation strategies. As August 2026 approaches, updated schedules will generate new observations that refine existing models and inform travel planning across both leagues.