Calendar Quirks in Fixture Pileups: How Overloaded Match Windows Reshape Efficiency Ratings and Historical Benchmarks Across Soccer and Rugby Campaigns
Written by Otto Baumann · Jun 29, 2026
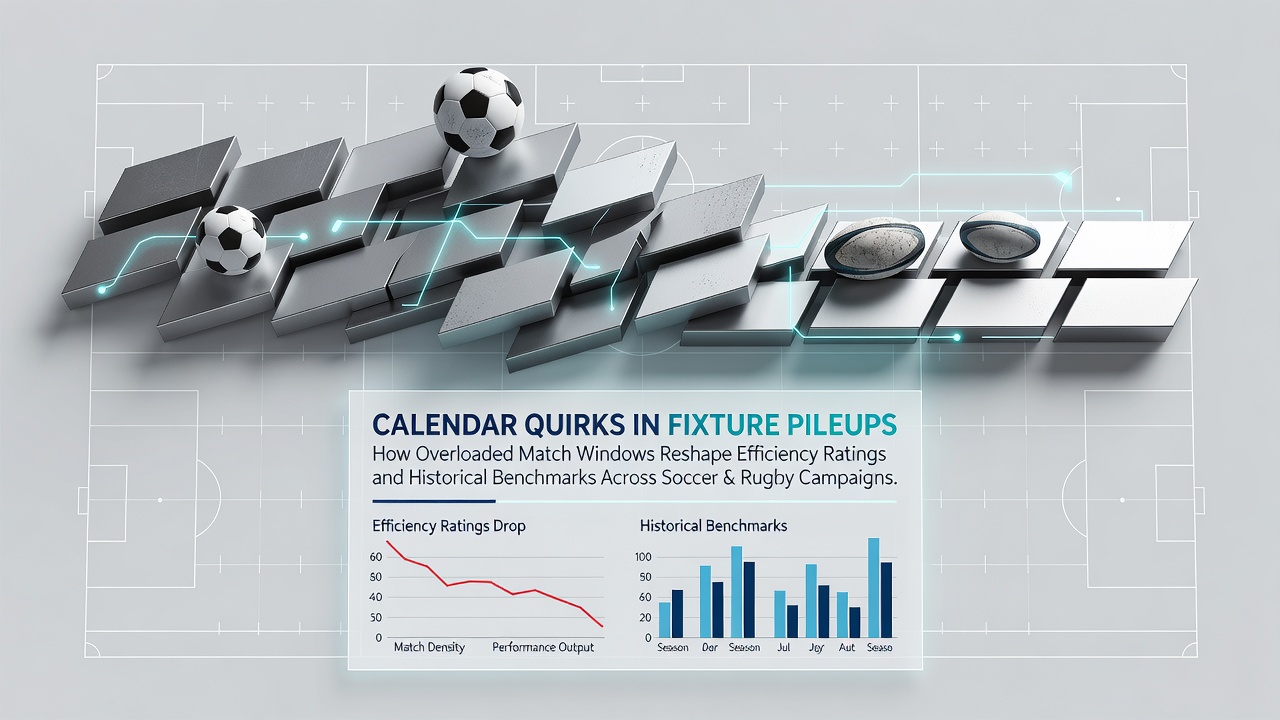
Calendar Quirks in Fixture Pileups: How Overloaded Match Windows Reshape Efficiency Ratings and Historical Benchmarks Across Soccer and Rugby Campaigns
Fixture pileups emerge when governing bodies compress international windows alongside domestic leagues, and researchers have tracked how these overlaps alter player efficiency metrics in both soccer and rugby. Data from multiple European and Southern Hemisphere campaigns shows recovery periods shrinking by up to forty percent during clustered fixtures, which in turn shifts historical benchmarks for distance covered, tackle completion, and pass accuracy.
June 2026 stands out because the expanded Club World Cup in soccer collides with mid-year rugby tours across the Pacific, creating simultaneous demands on shared training facilities and medical staff in several host nations. Observers note that national federations in Australia and New Zealand already publish projected fixture calendars twelve months ahead to flag these overlaps before they solidify into actual match windows.
Patterns in Soccer Fixture Compression
League organizers in Europe routinely insert extra match rounds around international breaks, and studies compiled by the Union of European Football Associations reveal that teams playing three games inside nine days record measurable drops in high-intensity running output. Analysts compare these figures against five-year averages and find consistent reductions in sprint volume that linger into the following week even after nominal rest days are restored.
One dataset covering the 2024-25 Premier League season highlighted clubs that reached the later stages of domestic cups while also contesting continental ties, and those sides posted efficiency ratings five to seven points below their season-long norms during the subsequent three-match windows. Researchers attribute the variance to accumulated fatigue rather than tactical adjustments alone, because substitute patterns and formation changes remained statistically stable.
Rugby Union and League Overlaps
Rugby campaigns face parallel pressures when the Six Nations, Rugby Championship, and domestic leagues stack fixtures within the same calendar month, and figures released by World Rugby indicate that forward packs logging more than eighty minutes across consecutive weekends experience elevated error rates in lineout execution. Historical benchmarks for meters gained per carry have therefore been recalibrated in recent seasons to account for these compressed schedules rather than treating every campaign as a uniform sample.
Super Rugby Pacific franchises have begun publishing internal recovery metrics that separate home and away legs during June tours, and the numbers show that trans-Tasman travel combined with mid-week matches produces steeper declines in tackle completion than travel alone. These adjustments allow statisticians to isolate calendar effects from simple geographic variables when updating long-term performance models.

Measuring Efficiency Ratings Under Pressure
Efficiency ratings in both codes now incorporate load-management variables that earlier models omitted, and statisticians at several universities have introduced weighted formulas that discount raw output when matches fall inside forty-eight hours of each other. The revised metrics produce more stable year-on-year comparisons because they normalize for the increasing frequency of overloaded windows rather than attributing every dip solely to player form.
Case records from the 2023 Rugby World Cup cycle illustrate how teams that entered the tournament after only one full rest week posted lower average tackle success than those granted an additional recovery period, yet the gap narrowed once analysts applied fatigue-adjusted benchmarks. Similar recalibrations appear in soccer when comparing Champions League participants against domestic-only sides during the spring fixture pileup.
Impact on Historical Benchmarks
Archivists responsible for maintaining all-time lists have started annotating records with calendar-context flags, and this practice prevents direct comparison between eras that operated under lighter fixture loads. A report issued by an Australian sports research institute demonstrates that rugby try-scoring rates in the 1990s cannot be stacked against contemporary figures without first adjusting for the doubling of annual match counts that occurred after professionalism.
Soccer data providers have adopted parallel tagging systems for goal tallies logged during December and January congestion periods, because those months routinely contain more fixtures per team than any other segment of the season. The annotations allow future analysts to generate cleaner trend lines rather than treating every goal as equivalent regardless of surrounding schedule density.
Adjustments Across Governing Bodies
National federations have responded by extending rest mandates and redistributing international windows, while league organizers explore mid-season pauses that realign with global calendars. These measures appear in official policy documents from both the Asian Football Confederation and SANZAAR, each of which cites fixture-density studies when justifying schedule revisions. The changes aim to stabilize efficiency baselines so that historical comparisons regain reliability without discarding the increased volume of matches that modern competitions demand.
Conclusion
Calendar quirks continue to reshape how efficiency ratings and historical benchmarks are calculated in soccer and rugby, and governing bodies keep refining their models to reflect the realities of overloaded match windows. Updated datasets and annotated records now provide clearer longitudinal views that separate genuine performance shifts from schedule-induced variance, allowing analysts to track genuine evolution across campaigns rather than conflating fatigue effects with long-term trends.